Fundamental Anchors: Trading via Economic and Intrinsic Value Levels
Quantitative Valuation Strategy- Defining the "Fundamental Floor"
- Book Value & Replacement Cost
- Dividend Yield Floor Anchors
- Historical P/E Band Regressions
- Commodity Production Cost Bases
- Central Bank Intervention Zones
- The Mathematics of DCF Levels
- Managing "Level Breakdown" Risk
- Converging Technicals with Value
- Synthesis: Systematic Execution
In technical analysis, traders focus on support and resistance levels derived from historical price clusters—essentially psychological markers left by the "crowd." However, institutional participants operate on a different plane: Fundamental Levels. These are price points where the underlying economic reality of an asset creates an objective floor or ceiling. Trading on fundamental levels is the practice of identifying the "hard value" of an asset, allowing a trader to enter positions with a high margin of safety during periods of irrational market volatility.
Success in this clinical discipline requires a transition from observing a chart to deconstructing a balance sheet or a macro-economic model. Whether it is the cost of extracting an ounce of gold, the net cash value of a corporation, or the interest rate parity of a currency pair, these levels represent the boundaries where the logic of finance overcomes the emotion of the ticker. This guide explores the systematic identification and execution of trades at these invisible but powerful economic barriers.
Defining the "Fundamental Floor"
A fundamental floor is the price at which the asset's liquidation value or cash-generating power makes it mathematically impossible (under rational conditions) for it to drop significantly further. While technical support can "break" if sentiment worsens, fundamental floors are anchored in Law and Math. For example, if a company is trading below its "Net Cash" position, investors are effectively getting the business for free. This creates a powerful gravitational pull that limits downside risk.
Conversely, a fundamental ceiling represents "Irrational Exuberance." This occurs when the valuation reaches a multiple that assumes impossible growth rates or ignores the cost of capital. Identifying these levels allows a trader to short into strength or exit positions before the "Valuation Reset" occurs. We treat these levels as Value Gates—until the price reaches these levels, the probability of a major reversal is low.
Book Value & Replacement Cost
For equity traders, the most foundational level is the Tangible Book Value (TBV). This represents the total value of a company's physical assets (buildings, machinery, cash) minus its total liabilities. When a profitable company trades at or below 1.0x TBV, it has reached a "Hard Floor."
Dividend Yield Floor Anchors
In mature, cash-generating sectors (Utilities, Consumer Staples), the "Floor" is often dictated by the Yield Spread. If a stable stock typically yields 4% and market volatility pushes the price down until the yield hits 7%, institutional yield-hungry funds will step in to buy. This "Yield Support" acts as a technical level that is fundamentally driven.
Professional quants track the 10-year Treasury yield as the "Risk-Free" benchmark. We look for the Equity Risk Premium (ERP) level. If the gap between a stock's earnings yield and the bond yield reaches a historical extreme (e.g., 2 standard deviations), we identify a "Valuation Level" that is ripe for a reversal.
Historical P/E Band Regressions
Every industry has a "Normal" valuation range. A software company might trade between 20x and 40x earnings, while a bank trades between 8x and 12x. We utilize Historical Multiple Regression to identify fundamental levels.
| Valuation Zone | Multiple Characteristic | Tactical Meaning |
|---|---|---|
| The Deep Value Zone | P/E < 5-year Minimum | High Probability Reversal Floor; Aggressive Buy. |
| The Fair Value Mean | P/E at 5-year Average | Equilibrium Point; No clear directional edge. |
| The Bubble Ceiling | P/E > 5-year Maximum + 1 Std Dev | Extreme Exhaustion Zone; Tighten Stops / Sell. |
Commodity Production Cost Bases
In commodities trading (Oil, Gold, Copper), the most effective fundamental level is the Marginal Cost of Production. If it costs $60 to extract and transport a barrel of oil for the least efficient producer needed to meet global demand, the price of oil has a "Structural Floor" at $60.
When price drops below production cost, producers shut down wells, reducing supply. This mathematical certainty ensures that price must eventually rise back above the cost of production. Trading "Production Cost Support" offers one of the highest win rates in global macro trading because it is based on the physics of supply and demand, not chart patterns.
Central Bank Intervention Zones
In the Forex and Bond markets, fundamental levels are often set by Central Bank Mandates. If a central bank (e.g., the Swiss National Bank or the Bank of Japan) has a specific "Inflation Target" or a "Currency Ceiling," they will deploy billions of dollars to defend that level.
The Mathematics of DCF Levels
Professional fundamentalists utilize the Discounted Cash Flow (DCF) model to find a "Fair Value" price. This level is our North Star. Unlike technical levels which can shift daily, a DCF level only shifts when the company's operating reality (earnings, debt, or interest rates) changes.
2. CALCULATE: Terminal Value (Terminal Growth = 2%)
3. DISCOUNT: Use WACC (Discount Rate r = 9%)
4. SUM: Present Value of all Cash Flows / Total Shares
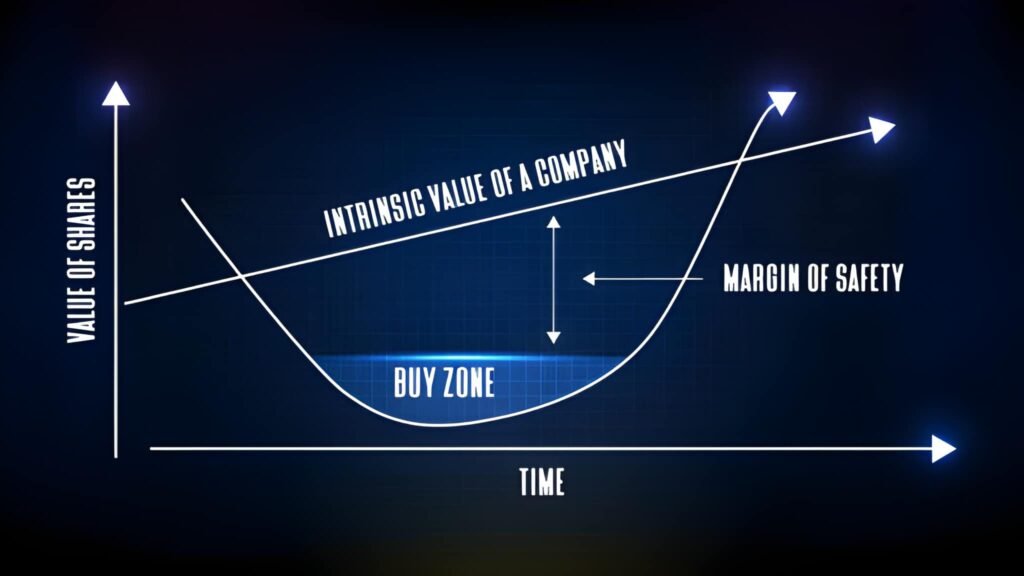
Intrinsic Level: $145.00
Trading Rule: If Market Price < $110.00 (25% Margin of Safety), Initiate Position.
Managing "Level Breakdown" Risk
The primary risk in fundamental level trading is Value Trap Risk. A stock can trade below book value for a reason—usually because the "Book" contains bad assets or the company is burning cash at a terminal rate. To manage this, we utilize a "Fundamental Stop-Loss."
If the reason for the trade—for example, a low P/E ratio—breaks because earnings collapse, the fundamental level has "dissolved." You do not hold a position if the underlying math that justified the level changes. We size our positions based on the Margin of Safety; the further we are below intrinsic value, the larger the position we can theoretically justify, provided the financial health remains intact.
Converging Technicals with Value
The ultimate professional strategy is Convergence. We use fundamental levels to decide What and Where to buy, and technical analysis to decide When to buy. Buying a stock simply because it is at a "Fundamental Level" can lead to "Dead Money" (sideways action for months).
Ideally, we wait for a fundamental level (e.g., 10x P/E) to align with a technical level (e.g., 200-day SMA). When an asset touches a fundamental floor and then produces a "Bullish Engulfing" candle or a volume surge, you have found a High-Conviction Pivot. The fundamental level provides the gravity, and the technical trigger provides the velocity.
Synthesis: Systematic Execution
Fundamental levels trading is the art of participating in Economic Reality. It is a discipline that rejects the noise of the crowd in favor of verified value anchors. By focusing on production costs, yield spreads, and intrinsic valuation models, a trader removes the emotional burden of decision-making. You are no longer guessing if a trend will hold; you are quantifying if the price makes sense relative to the asset's utility.
Ultimately, the market is a weighing machine. While the "voting" (price action) determines the short-term path, the "weight" (fundamentals) determines the destination. Respect the technical momentum, but always know where the fundamental floors reside. The most profitable trades occur when the crowd panics and pushes the price into a hard fundamental floor—it is there that wealth is structurally created. Trust the math, demand a margin of safety, and let the intrinsic value do the heavy lifting.


