
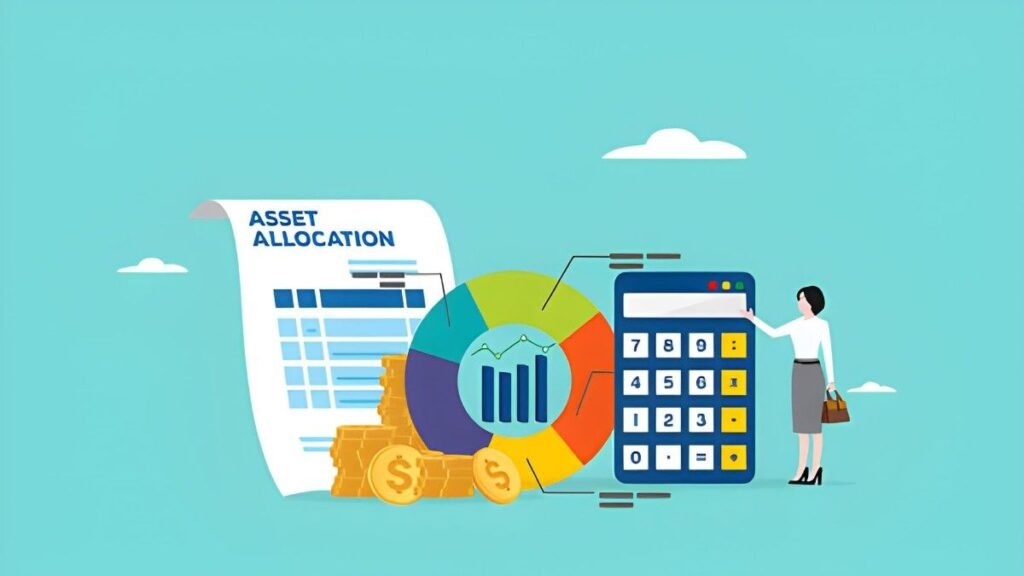
A well-constructed investment portfolio is not a random collection of assets; it is a carefully engineered structure designed to achieve a specific goal with a defined level of risk. The cornerstone of this structure is asset allocation—the strategic distribution of your investments across major asset classes like stocks, bonds, and cash. For modern investors who primarily use Exchange-Traded Funds (ETFs), calculating your true asset allocation is both essential and complex, as a single ETF can hold hundreds of underlying securities.
This guide provides a rigorous framework for calculating the precise asset allocation of an ETF-based portfolio. We will move beyond simple labels to dissect holdings, manage overlapping exposures, and use this analysis to maintain a portfolio that aligns with your long-term investment strategy.
Table of Contents
Why Asset Allocation is the Primary Determinant of Performance
Numerous studies, including a seminal 1986 paper by Brinson, Hood, and Beebower, concluded that over 90% of a portfolio’s variation in returns over time is explained by its asset allocation—not by individual security selection or market timing.
- Stocks (Equities) offer higher potential returns but come with higher volatility and risk of loss.
- Bonds (Fixed Income) offer lower potential returns but provide stability and income, acting as a shock absorber during equity market downturns.
- Cash & Equivalents offers stability and liquidity but with minimal growth, often failing to outpace inflation.
Your target allocation between these groups is the single most important investment decision you make. Calculating your current allocation is the process of measuring your actual position against this target blueprint.
Step 1: The Foundation – Gather Data and Identify Holdings
The first step is pure data collection. You need two key pieces of information for every ETF in your portfolio:
- The Current Market Value of Each Holding: This is not the price you paid, but the current value of your entire position in that ETF.
Position Value = Number of Shares × Current Price per Share
- The Total Portfolio Value: The sum of the current market value of all your holdings, including individual stocks, bonds, and cash.
Total Portfolio Value = Σ (Value of Holding 1 + Value of Holding 2 + ... + Value of Holding N)
Example Portfolio for Analysis:
Let’s assume a simple three-ETF portfolio with the following current values:
| ETF Ticker | Description | Number of Shares | Price per Share | Total Position Value |
|---|---|---|---|---|
| VTI | Vanguard Total Stock Market ETF | 50 | $220.00 | $11,000.00 |
| VXUS | Vanguard Total International Stock ETF | 100 | $55.00 | $5,500.00 |
| BND | Vanguard Total Bond Market ETF | 70 | $72.00 | $5,040.00 |
| Cash | $460.00 | |||
| Total Portfolio Value | $22,000.00 |
Step 2: Calculate Basic ETF Weights
Before diving into the underlying assets, calculate what percentage of your total portfolio each ETF represents. This is the weight of each holding.
Formula:
\text{Weight of ETF} = \frac{\text{Value of ETF Position}}{\text{Total Portfolio Value}}Calculation for our example:
- VTI Weight: \frac{\text{\$11,000}}{\text{\$22,000}} = 0.50 or 50.0%
- VXUS Weight: \frac{\text{\$5,500}}{\text{\$22,000}} = 0.25 or 25.0%
- BND Weight: \frac{\text{\$5,040}}{\text{\$22,000}} \approx 0.229 or 22.9%
- Cash Weight: \frac{\text{\$460}}{\text{\$22,000}} \approx 0.021 or 2.1%
| ETF Ticker | Position Value | Weight in Portfolio |
|---|---|---|
| VTI | $11,000.00 | 50.0% |
| VXUS | $5,500.00 | 25.0% |
| BND | $5,040.00 | 22.9% |
| Cash | $460.00 | 2.1% |
| Total | $22,000.00 | 100.0% |
This tells us the portfolio is 77.9% ETFs and 2.1% cash, but it doesn’t reveal the true asset allocation. For that, we must look inside the ETFs.
Step 3: The Critical Step – Analyze Underlying ETF Holdings
An ETF is a wrapper for a basket of securities. You must find and use the ETF’s official portfolio composition or breakdown. This information is freely available on the provider’s website (e.g., Vanguard, iShares, State Street) or on financial data sites like Morningstar.
Key Data Points to Find for Each ETF:
- Stock vs. Bond Allocation: The fund’s percentage in equities vs. fixed income.
- Domestic vs. International Exposure: For stock funds, the breakdown by country or region.
- Market Capitalization: Breakdown by Large-Cap, Mid-Cap, Small-Cap.
- Sector Weightings: Technology, Healthcare, Financials, etc. (for equity ETFs).
- Credit Quality & Duration: Government vs. Corporate bonds, credit ratings, average maturity (for bond ETFs).
Researching Our Example ETFs (Hypothetical Data):
- VTI (Total Stock Market ETF):
- 100% Equities
- 100% Domestic (US)
- Breakdown: 75% Large-Cap, 15% Mid-Cap, 10% Small-Cap
- VXUS (Total International Stock ETF):
- 100% Equities
- 100% International (Non-US)
- Breakdown: 80% Developed Markets, 20% Emerging Markets
- BND (Total Bond Market ETF):
- 100% Fixed Income (Bonds)
- Breakdown: 70% US Government, 30% Corporate Bonds
Step 4: Calculate True Portfolio Allocation
This is where we aggregate the exposures. We multiply each ETF’s portfolio weight by the internal allocation of its holdings.
1. Calculate Broad Asset Class Allocation (Stocks vs. Bonds vs. Cash):
- US Stocks: Only VTI holds this.
Allocation = VTI Weight × % Stocks in VTI = 50.0% × 100% = 50.0%
- International Stocks: Only VXUS holds this.
Allocation = VXUS Weight × % Stocks in VXUS = 25.0% × 100% = 25.0%
- **Total Stocks = US + International = 50.0% + 25.0% = 75.0%`
- Bonds: Only BND holds this.
Allocation = BND Weight × % Bonds in BND = 22.9% × 100% = 22.9%
- Cash: We have 2.1% direct cash.
| Asset Class | Calculation | Final Allocation |
|---|---|---|
| US Stocks | 50.0% × 100% | 50.0% |
| Int’l Stocks | 25.0% × 100% | 25.0% |
| Total Stocks | 75.0% | |
| Total Bonds | 22.9% × 100% | 22.9% |
| Cash | 2.1% | |
| Total Portfolio | 100.0% |
2. Calculate Sub-Asset Class Allocation (Drilling Deeper):
We can use the same method to get more granular. For example, to calculate the US Small-Cap exposure:
Small-Cap Allocation = VTI Weight × % Small-Cap in VTI = 50.0% × 10% = 5.0%
To calculate exposure to Corporate Bonds:
Corporate Bond Allocation = BND Weight × % Corporate in BND = 22.9% × 30% ≈ 6.9%
Table: Detailed Allocation Breakdown
| Asset Sub-Class | Calculation | Allocation |
|---|---|---|
| US Large-Cap | 50.0% × 75% | 37.5% |
| US Mid-Cap | 50.0% × 15% | 7.5% |
| US Small-Cap | 50.0% × 10% | 5.0% |
| Int’l Developed | 25.0% × 80% | 20.0% |
| Int’l Emerging | 25.0% × 20% | 5.0% |
| US Govt Bonds | 22.9% × 70% | 16.0% |
| Corporate Bonds | 22.9% × 30% | 6.9% |
| Cash | 2.1% | |
| Total | 100.0% |
Step 5: Analyze, Compare, and Rebalance
The final step is to compare your calculated actual allocation against your target allocation.
Example Target vs. Actual:
| Asset Class | Target Allocation | Actual Allocation | Deviation | Action |
|---|---|---|---|---|
| US Stocks | 48% | 50.0% | +2.0% | Sell |
| Int’l Stocks | 27% | 25.0% | -2.0% | Buy |
| Total Stocks | 75% | 75.0% | 0.0% | |
| Total Bonds | 23% | 22.9% | -0.1% | Buy |
| Cash | 2% | 2.1% | +0.1% |
This analysis reveals that due to market movements (US stocks outperforming international stocks), the portfolio has drifted from its target. It is now overweight US stocks and underweight international stocks and bonds. The process of rebalancing—selling portions of the overweight asset and buying the underweight assets—is necessary to bring the portfolio back to its target risk level.
Tools and Practical Tips
- Use a Spreadsheet: A spreadsheet is the most powerful and transparent tool for this calculation. Create columns for each asset sub-class and use formulas to multiply ETF weights by their compositions.
- Leverage Portfolio Tools: Many brokerage firms (e.g., Vanguard, Fidelity, Charles Schwab) offer built-in portfolio analysis tools that automatically perform this underlying holding analysis. Their accuracy depends on the timeliness of their data.
- Frequency: Performing this calculation quarterly or semi-annually is sufficient for most investors. Rebalancing should only be done when deviations exceed a predetermined threshold (e.g., 5% absolute or 25% relative) to avoid unnecessary trading costs and taxes.
Conclusion: Allocation as a Continuous Process
Calculating your ETF portfolio’s asset allocation is not a one-time event but a core discipline of prudent investing. It moves your focus from “Which ETFs do I own?” to “What am I actually exposed to?” This clarity allows you to consciously manage risk, ensure your portfolio remains aligned with your long-term goals and risk tolerance, and make intentional adjustments through rebalancing. By mastering this process, you transition from being a mere investor to the architect of your financial future.



