The Duality of Wealth: Understanding Technical and Fundamental Stock Trading
Stock trading represents a rigorous intellectual challenge where participants engage in a constant search for value and timing. To succeed, an investor must navigate two distinct philosophies that often appear at odds. Fundamental analysis seeks the intrinsic value of a business, treating a stock as a fractional ownership of a living, breathing entity. Technical analysis, conversely, views the ticker symbol as a variable governed by the immutable laws of supply and demand, focusing on the rhythm of price action.
Mastery requires an understanding of both dimensions. While a fundamentalist asks "What is this company worth?", a technician asks "When will the market realize that worth?". This guide explores the intricate aspects of both disciplines, providing the framework needed to build a professional-grade portfolio in the modern financial landscape.
Fundamental Analysis: The Business DNA
Fundamental analysis operates on the premise that the market occasionally misprices assets in the short term. However, the investor believes that price eventually gravitates toward value. This discipline requires a deep dive into financial statements, management quality, and competitive advantages.
Quantitative Metrics: The Hard Numbers
Professional investors begin their journey in the SEC EDGAR database, scrutinizing 10-K and 10-Q filings. They focus on the three primary financial statements: the Balance Sheet, the Income Statement, and the Cash Flow Statement.
Price-to-Earnings (P/E): Measures how much investors pay for every dollar of profit. A high P/E suggests growth expectations; a low P/E may indicate a value play or structural weakness.
Debt-to-Equity: Measures financial leverage. High debt increases risk during interest rate hikes but can amplify returns during expansionary periods.
Return on Equity (ROE): Measures the efficiency of management in generating profits from shareholder capital. Institutional investors look for consistency in this metric over five-year cycles.
Free Cash Flow (FCF): Represents the actual cash a business generates after capital expenditures. Cash flow, unlike accounting earnings, is difficult to manipulate.
Qualitative Factors: The Intangible Edge
Numbers alone rarely tell the full story. A fundamentalist must also evaluate the economic moat—a term popularized by Warren Buffett. This refers to a company's ability to maintain competitive advantages over its rivals to protect its long-term profits and market share. Factors like brand loyalty, proprietary technology, and high switching costs define the strength of the moat.
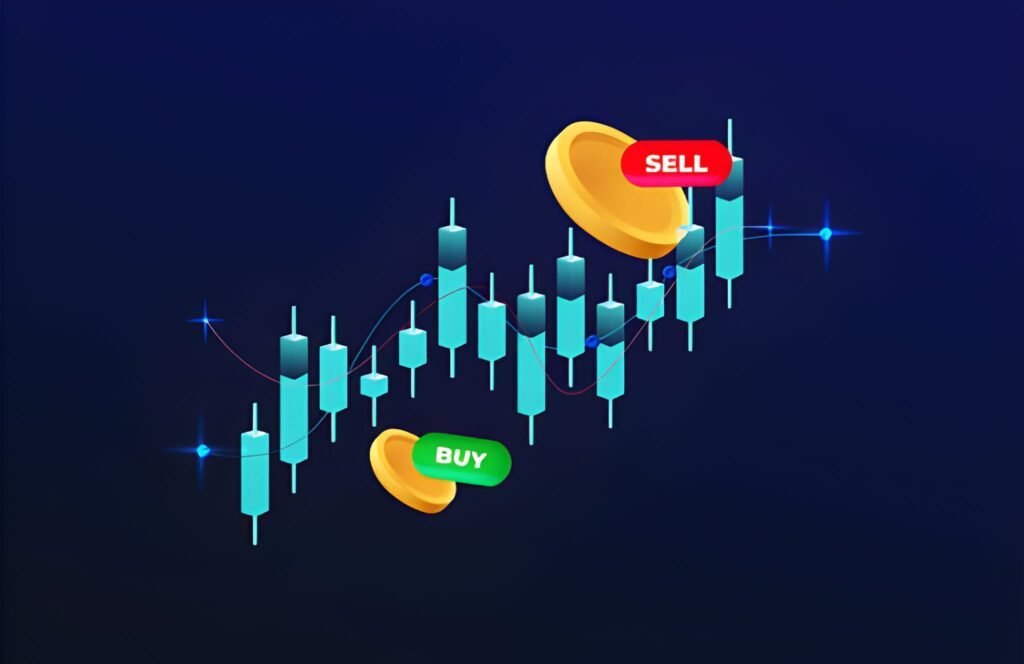
Technical Analysis: The Market Pulse
Technical trading discards the balance sheet in favor of the chart. It assumes that all known fundamental information, including earnings, news, and sentiment, already reflects in the current price. The technician looks for patterns that repeat because human psychology remains constant across generations.
Identifies the path of least resistance. Technicians use Moving Averages (50-day and 200-day) to determine if a stock resides in an accumulation or distribution phase.
Uses oscillators like the RSI (Relative Strength Index) to identify when a move has become overextended. This helps prevent "buying the top."
The Law of Supply and Demand
Every technical level represents a historical memory of profit or pain. Support exists at price levels where buyers historically step in to prevent further declines. Resistance marks the ceiling where sellers outnumber buyers. Breakouts from these levels often signal a significant shift in market equilibrium, providing the catalyst for a swing trade.
Time Horizons and Capital Efficiency
The choice between these two schools often depends on the trader's time horizon. Fundamental analysis generally requires a long-term perspective—often three to five years. It takes time for a business to execute its strategy and for the market to correct its pricing errors.
Technical trading operates on much shorter cycles. A swing trader might look to hold a position for three days to three weeks. Their goal is capital rotation—moving money into the most efficient trends to compound returns faster than a buy-and-hold strategy.
| Feature | Fundamental Analysis | Technical Analysis |
|---|---|---|
| Primary Goal | Identify Intrinsic Value | Identify Timing and Momentum |
| Data Source | Financial Statements & News | Price Charts & Volume |
| Time Horizon | Long-term (Years) | Short-term (Days/Weeks) |
| Market View | Value will eventually win | Price discounts everything |
| Primary Risk | Value Trap / Structural Shift | False Breakouts / Whiplash |
Valuation Models vs. Probability Math
Investors justify their entries using different mathematical frameworks. The fundamentalist uses the Discounted Cash Flow (DCF) model, projecting future cash flows and discounting them back to the present value using a required rate of return.
Terminal Value = Cash Flow / (Discount Rate - Growth Rate) 1,000,000 / (0.10 - 0.05) = 1,000,000 / 0.05 Intrinsic Value: 20,000,000
The technical trader, however, thinks in terms of Expectancy. They do not care about the "fair value" of the company. They care about the win rate and the reward-to-risk ratio. A strategy that wins 40% of the time can be highly profitable if the average win is three times larger than the average loss.
US Socioeconomic Context and the Fed
No aspect of stock trading exists in a vacuum. In the United States, the Federal Reserve acts as the ultimate technical and fundamental catalyst. Interest rates define the "cost of capital." When the Fed raises rates to combat inflation, fundamental valuations drop because the discount rate in DCF models increases.
Socioeconomically, higher rates impact consumer spending and corporate borrowing costs. Technicians watch for the "Fed Pivot"—the moment the central bank shifts from a hawkish to a dovish stance—as the primary signal for the start of a new bull market. Understanding the Yield Curve and inflation data (CPI) is non-negotiable for anyone trading the US equity markets.
Synthesizing the Hybrid Edge
The most successful institutional desks utilize a synthetic approach. They use fundamental analysis to build a "Buy List" of high-quality companies with strong earnings growth and durable moats. These are the stocks they *want* to own.
However, they use technical analysis to time their entry. They wait for a high-quality fundamental stock to experience a technical "washout" or pull back to a major support level, such as the 200-day moving average. This ensures they do not overpay for value. They buy great businesses when the charts indicate that the selling has exhausted.
Risk Management and Investor Psychology
The final and most critical aspect of trading is the management of one's own psychology. The market is a machine designed to transfer wealth from the impatient to the patient. Technical traders use stop-losses to exit positions when their thesis fails, preventing small losses from turning into portfolio-destroying catastrophes.
Fundamentalists use a margin of safety. If they calculate an intrinsic value of $100, they might only buy the stock at $70. This 30% discount provides a buffer against errors in their valuation model or unexpected economic shocks.
Confirmation Bias: Seeking out news that supports your current position while ignoring data that contradicts it. Professional traders actively search for the "bear case" to test their conviction.
Recency Bias: Believing that what happened in the last three months will continue indefinitely. This leads to over-leveraging at market tops and panic selling at bottoms.
Sunk Cost Fallacy: Holding onto a losing position because you have already "invested" so much time or money into it. The market does not know or care what price you paid.
Trading stocks requires a balance of analytical rigor and emotional detachment. Whether you lean toward the balance sheet or the candlestick chart, your survival depends on a disciplined process. Markets represent a collective expression of human hope and fear; those who can quantify these emotions while remaining grounded in financial reality hold the keys to long-term wealth.
Consistent journaling, rigorous backtesting, and a commitment to lifelong learning define the expert trader. The landscape changes, interest rates fluctuate, and new technologies emerge, but the core aspects of trading—identifying value and managing risk—remain the steady foundations of success.


