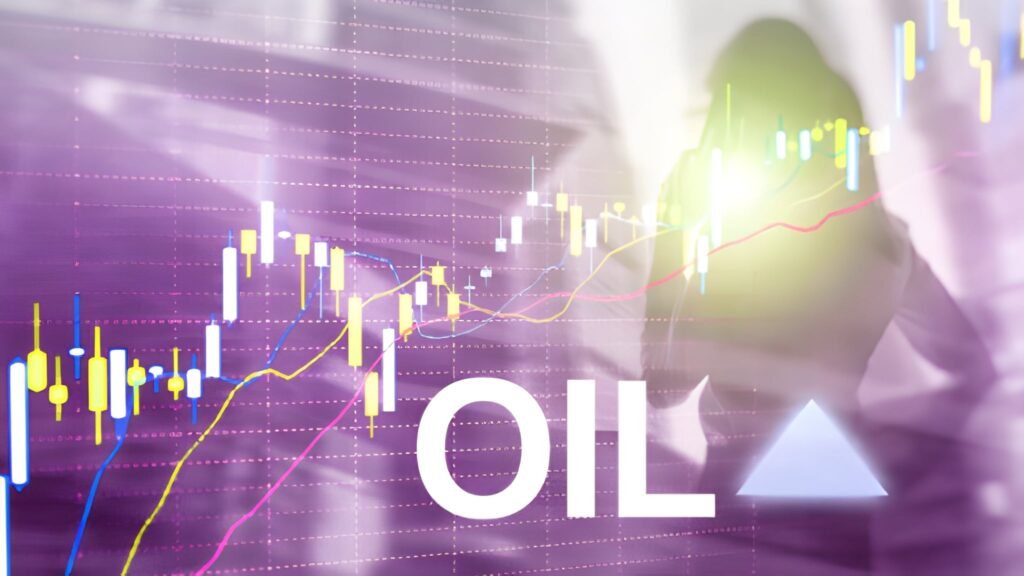
Crude Realities: A Professional Framework for Oil Trading Fundamentals
Global Energy Macro Analysis- WTI vs. Brent: Global Architectures
- OPEC+ and Sovereign Supply Control
- The US Shale Revolution & Marginal Cost
- Global GDP and Seasonal Cycles
- EIA/API: The Weekly Truth Check
- Backwardation vs. Contango Logic
- The US Dollar & Currency Impacts
- The Crack Spread: Refining Margins
- Geopolitical Alpha and Risk Premia
- Synthesis: The Trading Checklist
Oil is the lifeblood of the global economy, making it the most liquid and volatility-dense commodity in the financial markets. Fundamental analysis in oil trading is not a predictive "guess," but a clinical study of Global Physical Equilibrium. Unlike equities, which represent growth potential, an oil contract represents a physical requirement. When supply is disrupted or demand surges, the price must adjust vertically to reach a new clearing level. Success in this arena requires a transition from being a chart reader to becoming a Macro-Logistics Strategist.
This guide deconstructs the institutional-grade variables—ranging from OPEC spare capacity to the physics of the refining crack spread—that move the energy market. We treat oil as a "Tension Asset," identifying the rare windows where fundamental catalysts align to create high-velocity directional trends. Whether you are trading WTI or Brent, understanding these foundational mechanics is the prerequisite for professional-grade execution.
WTI vs. Brent: Global Architectures
The global oil market is defined by two primary benchmarks. WTI (West Texas Intermediate) is the US benchmark, primarily priced at the Cushing, Oklahoma storage hub. Brent Crude is the global benchmark, sourced from the North Sea and reflecting the international supply-demand balance. The spread between the two (WTI/Brent Spread) is a fundamental signal of US energy independence vs. global scarcity.
OPEC+ and Sovereign Supply Control
The Organization of the Petroleum Exporting Countries (plus Russia and other allies, known as OPEC+) remains the market's "Swing Producer." Their primary fundamental goal is Price Stability (often at levels that support their national budgets). We monitor "Spare Capacity"—the amount of oil OPEC can bring to market within 30 days. When spare capacity is low, the market is "Thin," and price sensitivity to geopolitical shocks is maximized.
The US Shale Revolution & Marginal Cost
US Shale production changed the fundamental math of oil. Unlike traditional deep-sea wells that take years to develop, shale wells can be brought online in months. This makes US production the Marginal Supply. The "Rig Count" (tracked by Baker Hughes) is the lead indicator for future US production. If the rig count is rising, supply is expanding with a 6-month lag.
The "Hard Math" floor of oil is the Cash Cost of Production for shale. If the price drops below $40-$50 (depending on the basin), drilling becomes unprofitable, rigs are shut down, and supply eventually contracts. This establishes a fundamental support level that technical analysis often misses.
EIA/API: The Weekly Truth Check
Every Wednesday at 10:30 AM EST, the US Energy Information Administration (EIA) releases the Weekly Petroleum Status Report. This is the most significant fundamental event for oil traders. It provides the delta between the market's previous assumptions and the current physical reality of stocks in storage.
2. Product Stocks: Gasoline and Distillate levels indicate consumer demand health.
3. Refinery Utilization: High utilization suggests strong crude demand from refiners.
4. Net Imports: Reveals if US supply is being supplemented or exported globally.
Backwardation vs. Contango Logic
The "Shape" of the futures curve is the ultimate fundamental signal. It tells you if the market is currently oversupplied or in a deficit. This is known as the Term Structure.
| Term State | Price Structure | Fundamental Meaning |
|---|---|---|
| Backwardation | Current Price > Future Price | Scarcity. Buyers pay a premium for immediate delivery. Bullish. |
| Contango | Current Price < Future Price | Glut. It is cheaper to buy now and store for later. Bearish. |
| Super Contango | Deep discount in front months | Storage capacity is full; market is in a supply emergency. |
The US Dollar & Currency Impacts
Oil is denominated in US Dollars ($/bbl). Consequently, there is a strong inverse correlation with the DXY (US Dollar Index). Because oil is a global asset, a stronger dollar makes oil more expensive for holders of other currencies, which mathematically reduces international demand. Furthermore, the CAD/USD pair is highly sensitive to oil prices, as Canada is a major oil exporter (The "Loonie" is a petro-currency).
The Crack Spread: Refining Margins
Refineries do not buy oil to keep it; they buy it to "crack" it into gasoline and diesel. The Crack Spread measures the profit margin of this process. If refining margins are high, refiners will demand more crude oil, driving prices higher. If margins collapse, refiners will cut runs, leading to a build-up in crude inventories and lower prices.
Trading Insight: If the 3:2:1 spread is rising, it indicates that product demand is outstripping crude supply—a leading bullish indicator for oil.
Geopolitical Alpha and Risk Premia
Oil is a "Geopolitical Weapon." Events in the Strait of Hormuz, Libyan unrest, or sanctions on major producers (Iran, Venezuela) create Risk Premia. A risk premium is the extra amount investors pay for oil to protect against a potential supply shock. When geopolitics are calm, the risk premium "evaporates," leading to price drops even if supply/demand is balanced.
Synthesis: The Fundamental Audit
Before entering an oil position, a professional performs a Convergence Audit. You want as many physical and macro winds as possible at your back. A high-conviction oil trade occurs when technical breakouts align with inventory draws and backwardation.
- Inventory Audit: Did the EIA show a crude draw while refinery runs were rising?
- Policy Audit: Is OPEC+ adhering to their quotas or showing signs of "cheating"?
- Structure Audit: Is the front-month spread in backwardation?
- Dollar Audit: Is the DXY showing signs of a reversal or structural weakness?
- Margin Audit: Are crack spreads healthy enough to sustain refiner demand?
Professional Summary
Oil trading is the science of Inventory and Flow. By focusing on sovereign supply control, marginal shale costs, and refining margins, you remove the emotional burden of directional betting. Oil is a physical commodity governed by the physics of logistics. Respect the inventory reports, follow the term structure, and let the intrinsic physical value of crude drive your portfolio alpha. The market doesn't pay for your opinion; it pays for your understanding of global equilibrium.


