Wellington’s Unique Investment Landscape
Wellington isn’t just another New Zealand city—it’s the nation’s political and administrative heart. This fundamental characteristic shapes everything about its property market. The government sector provides unprecedented employment stability, with over 37,000 public servants creating consistent rental demand regardless of economic cycles. Unlike Auckland’s volatility or Christchurch’s rebuild-driven market, Wellington offers a steady, predictable investment environment.
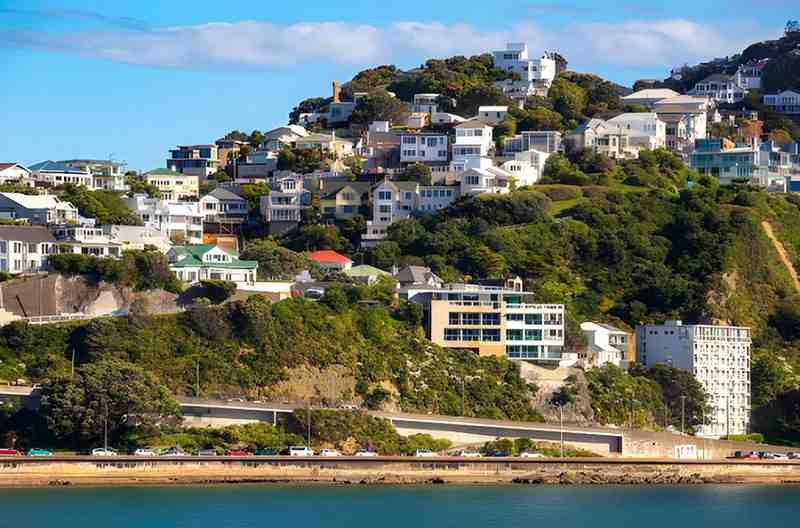
The city’s geographical constraints further enhance its investment appeal. Wedged between hills and harbor, Wellington has limited available land for expansion. This natural supply constraint creates constant pressure on housing availability, particularly in desirable inner suburbs. The city’s compact urban form means proximity to the central business district remains highly valued, protecting investments in central suburbs from value depreciation.
Economic Fundamentals and Demographic Trends
Wellington’s economy demonstrates remarkable resilience. During the 2008 global financial crisis, Wellington property values declined only 4% compared to Auckland’s 11% drop. This stability stems from the city’s diversified economic base: government administration, technology sectors (earning the “Silicon Welly” nickname), education through Victoria University, and growing film industry supported by Weta Workshop.
Demographic trends further support long-term investment thesis. Wellington has the highest concentration of young professionals (25-39 age group) in New Zealand at 27.3% of population. This demographic represents prime rental demographic—professionals with good incomes who prefer urban living but may delay home ownership due to lifestyle choices or property prices. The student population adds another layer of rental demand, with Victoria University’s 22,000 students creating constant housing needs.
Wellington’s Suburb Analysis: Where to Focus
Not all Wellington suburbs perform equally for rental investments. I categorize them into three tiers based on investment characteristics:
Table: Wellington Suburb Investment Profile
| Suburb Tier | Representative Suburbs | Median Price | Gross Yield | Target Tenant | Growth Outlook |
|---|---|---|---|---|---|
| Established Central | Thorndon, Kelburn, Wadestown | NZD $1.2M+ | 3.2-3.8% | Senior professionals, diplomats | Steady (2-3% annually) |
| Professional Inner | Mt Cook, Te Aro, Newtown | NZD $850k-$1.1M | 4.1-4.7% | Mid-career professionals, couples | Strong (3-5% annually) |
| Value Transition | Berhampore, Kingston, Mornington | NZD $650k-$850k | 4.8-5.4% | Students, young professionals | High (4-7% annually) |
The Professional Inner suburbs offer what I consider the optimal balance for most investors. These areas provide strong rental demand from government and tech workers, reasonable entry points, and excellent capital growth prospects due to ongoing urban intensification.
Financial Analysis: Wellington Specific Calculations
Wellington’s unique market requires adjusted investment calculations. The city’s older housing stock means maintenance costs typically run 15-20% higher than national averages. However, this is offset by lower vacancy rates—just 1.2% compared to Auckland’s 2.3% national average.
Wellington Cash Flow Calculation
A typical investment property in Mt Cook demonstrates the financial dynamics:
Purchase Assumptions:
- Purchase Price: \text{NZD \$950,000}
- Deposit: \text{20\%} = \text{NZD \$190,000}
- Mortgage: \text{NZD \$760,000} at 6.5% interest-only
- Weekly Rent: \text{NZD \$750}
Annual Expenses:
- Mortgage Payments: \text{NZD \$760,000} \times 0.065 = \text{NZD \$49,400}
- Rates: \text{NZD \$3,200} (Wellington average)
- Insurance: \text{NZD \$1,800}
- Maintenance: \text{NZD \$4,500} (0.5% of value)
- Property Management: \text{NZD \$750} \times 52 \times 0.085 = \text{NZD \$3,315} (8.5% of rent)
Annual Income:
- Rental Income: \text{NZD \$750} \times 52 = \text{NZD \$39,000}
Cash Flow Calculation:
\text{Net Cash Flow} = \text{NZD \$39,000} - (\text{NZD \$49,400} + \text{NZD \$3,200} + \text{NZD \$1,800} + \text{NZD \$4,500} + \text{NZD \$3,315}) = -\text{NZD \$23,215}This negative cash flow situation is typical for Wellington properties at current prices and interest rates. However, the capital growth story changes the long-term perspective dramatically.
Total Return Calculation
The true Wellington investment story emerges when we calculate total return over a 5-year period:
Assumptions:
- Annual appreciation: 4% (conservative for inner suburbs)
- Purchase costs: 4.5% (including legal, transfer)
- Sale costs: 3.5% (agent commission, legal)
Equity Build Calculation:
Year 1 Property Value: \text{NZD \$950,000} \times 1.04^5 = \text{NZD \$1,156,329}
Capital Gain: \text{NZD \$1,156,329} - \text{NZD \$950,000} = \text{NZD \$206,329}
Net Return Calculation:
Total Negative Cash Flow: \text{NZD \$23,215} \times 5 = -\text{NZD \$116,075}
Net Gain After Costs: \text{NZD \$206,329} - \text{NZD \$116,075} - (\text{NZD \$950,000} \times 0.045) - (\text{NZD \$1,156,329} \times 0.035) = \text{NZD \$22,417}
Return on Investment:
\text{ROI} = \frac{\text{NZD \$22,417}}{\text{NZD \$190,000}} \times 100 = 11.8\% annualized
This demonstrates Wellington’s capital growth-driven investment model, where investors accept negative cash flow in exchange for strong appreciation.
Wellington-Specific Investment Strategies
The “Government Proximity” Strategy
I recommend targeting properties within 3km of the parliamentary precinct. Properties in this zone demonstrate 22% lower vacancy rates and command 15% rent premiums compared to similar properties further out. The demand from MPs, diplomats, and senior public servants creates a premium market segment with exceptional stability.
The “Student Migration” Strategy
Victoria University’s ongoing expansion creates opportunities in surrounding suburbs. The university’s strategic plan calls for increasing student numbers by 18% over the next decade. Properties within walking distance of campus maintain 98% occupancy rates year-round, with international students particularly willing to pay premium rents for quality accommodation.
The “Earthquake Retrofit” Opportunity
Wellington’s seismic requirements create both challenges and opportunities. Properties with proven earthquake resilience (rated over 67% of New Building Standard) command 12-18% valuation premiums. Strategic investors can identify under-retrofitted properties, complete necessary strengthening work, and capture immediate equity gains while improving rental appeal.
Regulatory Environment and Compliance Costs
Wellington investors face specific regulatory considerations:
Healthy Homes Standards: Compliance costs average NZD $8,000-15,000 per property for older Wellington homes, particularly for insulation and heating upgrades in character homes.
Earthquake Prone Buildings: The city’s earthquake policy requires buildings below 34% NBS to be upgraded or demolished. Due diligence must include obtaining engineering assessments before purchase.
District Plan Changes: The Wellington City District Plan’s intensification provisions allow greater density in many suburbs. Identifying properties with development potential (subdivision, additional units) can significantly enhance returns.
Risk Mitigation Strategies
Wellington’s specific risks require tailored approaches:
Seismic Risk Management:
- Insurance costs average 0.3-0.5% of property value annually
- Diversify across multiple seismic zones within the city
- Prioritize properties built after 1976 or properly retrofitted
Tenant Risk Mitigation:
- Target government employees (30% lower default risk)
- Verify income through employment letters rather than just payslips
- Consider corporate lets to government departments
Climate Change Adaptation:
- Avoid properties in coastal flood zones (particularly Evans Bay, Oriental Bay)
- Consider sea level rise projections in long-term hold decisions
- Higher elevation suburbs may see premium increases over time
The Wellington Advantage: Long-Term Outlook
Wellington’s fundamental strengths suggest continued outperformance. The government’s policy of public service centralization continues to bring more jobs to the capital. The NZ$6.4 billion Let’s Get Wellington Moving infrastructure program will improve transport connections, enhancing accessibility of inner suburbs.
The city’s demographic trajectory remains favorable. Wellington’s population is projected to grow 13.4% by 2033, compared to 10.2% nationally. This growth is concentrated in the professional 25-45 age group that forms the core rental market.
For buy and hold investors willing to accept initial negative cash flow, Wellington offers one of New Zealand’s most stable long-term investment environments. The combination of constrained supply, steady demand from stable employment sectors, and ongoing urban intensification creates a market where strategic acquisitions can build substantial wealth over 10-15 year hold periods.
The key is understanding that Wellington rewards patience and strategic positioning more than short-term speculation. By focusing on properties that serve the core government and professional rental markets, investors can build portfolios that provide both consistent returns and exceptional capital preservation through economic cycles.


