Introduction
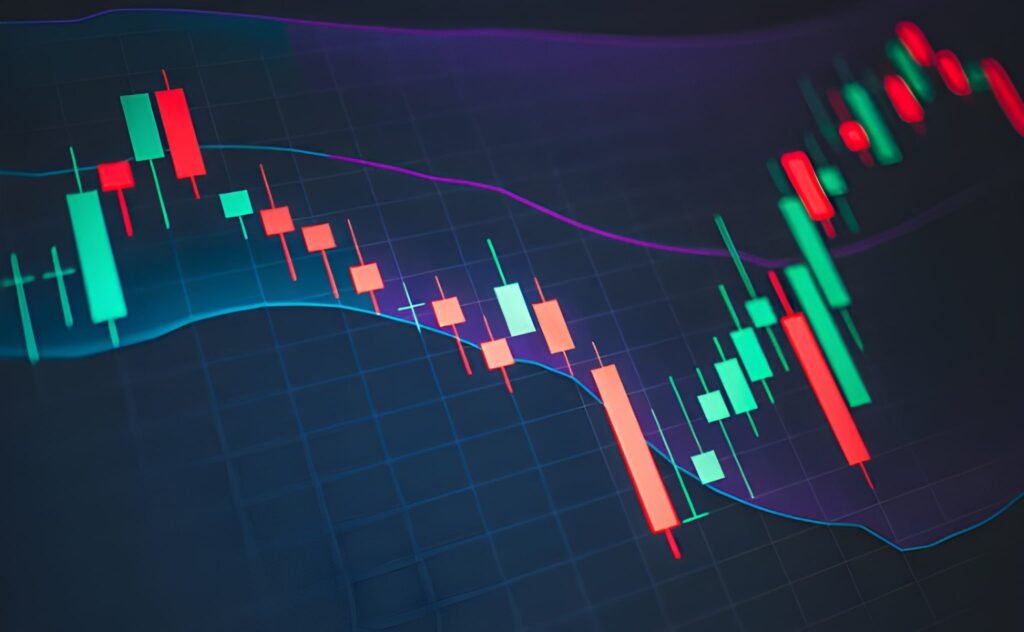
Bollinger Bands are a widely used technical indicator that measures volatility and identifies potential price reversals in financial markets. In algorithmic trading, Bollinger Bands are employed to automate trading strategies, capture mean-reversion opportunities, and enhance risk-adjusted returns. This approach is especially relevant for U.S. equities, ETFs, and forex markets, where volatility patterns provide actionable signals.
This article explores how Bollinger Bands are used in algorithmic trading, including strategy design, implementation, backtesting, and risk management.
1. Understanding Bollinger Bands
Bollinger Bands consist of three lines:
- Middle Band: A simple moving average (SMA) representing the average price over a period.
- Upper Band: Typically two standard deviations above the SMA.
- Lower Band: Typically two standard deviations below the SMA.
{\text{Middle Band}} = SMA_t = \frac{1}{n} \sum_{i=0}^{n-1} Price_{t-i}
{\text{Upper Band}} = SMA_t + k \cdot \sigma_t
Where \sigma_t is the standard deviation of the last n prices and k is the number of standard deviations, commonly set to 2.
2. Bollinger Bands Trading Logic
Bollinger Bands strategies exploit price deviations from the SMA.
Mean Reversion Strategy:
- Buy Signal: When price touches or crosses below the lower band.
- Sell Signal: When price touches or crosses above the upper band.
- Exit Rules: Close positions when price returns to the middle band or reaches a predefined profit target.
Trend-Following Strategy:
- Buy Signal: Price closes above the upper band with increasing momentum.
- Sell Signal: Price closes below the lower band with decreasing momentum.
- Confirmation: Use additional indicators like RSI or MACD to filter false signals.
3. Implementing Bollinger Bands in Algorithmic Trading
Python Example:
import pandas as pd
import numpy as np

def bollinger_bands(data, window=20, num_std=2):
    sma = data['Close'].rolling(window).mean()
    std = data['Close'].rolling(window).std()
    upper_band = sma + num_std * std
    lower_band = sma - num_std * std
    return sma, upper_band, lower_band

data['SMA'], data['Upper'], data['Lower'] = bollinger_bands(data)
Algorithmic Execution Rules:
- Generate signals based on price interactions with bands.
- Implement risk management rules for position sizing:
Automate trade execution via broker API (Interactive Brokers, Alpaca, or NinjaTrader).
4. Backtesting and Optimization
Backtesting is critical to evaluate strategy performance under historical market conditions.
Steps:
- Use historical price data for U.S. stocks, ETFs, or forex pairs.
- Simulate Bollinger Band signals, including transaction costs and slippage.
- Optimize parameters: SMA period n, standard deviation multiplier k, stop-loss, and take-profit levels.
- Evaluate metrics: cumulative return, Sharpe ratio, maximum drawdown, win/loss ratio.
Example Table: Backtesting Results
| SMA Period | Std Dev Multiplier | Return (%) | Sharpe Ratio | Max Drawdown (%) |
|---|---|---|---|---|
| 20 | 2 | 15.2 | 1.25 | 8.7 |
| 30 | 2.5 | 12.8 | 1.10 | 7.9 |
| 15 | 2 | 16.4 | 1.30 | 9.5 |
5. Risk Management
Proper risk management ensures consistent performance:
- Stop-Loss Orders: Limit losses when price moves beyond acceptable thresholds.
- Position Sizing:
Portfolio Diversification: Apply Bollinger Band strategies across multiple assets to reduce correlation risk.
Volatility Adjustment: Modify trade size based on market volatility for more conservative execution.
6. Advantages of Bollinger Bands in Algorithmic Trading
- Objective Signals: Clear entry and exit rules reduce emotional trading.
- Adaptability: Bands automatically adjust to changing volatility.
- Compatibility: Works with trend-following and mean-reversion strategies.
- Automation-Friendly: Simple calculations and clear signals make it ideal for algorithmic implementation.
7. Considerations and Limitations
- False Signals: In highly trending markets, mean-reversion signals may fail.
- Parameter Sensitivity: Optimal SMA and standard deviation parameters vary across assets and market conditions.
- Market Liquidity: Low liquidity may increase slippage and reduce strategy efficiency.
Conclusion
Bollinger Bands provide a robust framework for algorithmic trading in U.S. markets. Whether applied to mean-reversion or trend-following strategies, they offer objective, volatility-adjusted signals suitable for automation. By integrating backtesting, risk management, and parameter optimization, traders can implement effective Bollinger Band algorithms that balance profitability and risk.
{\text{Position Size}} = \frac{\text{Risk Per Trade}}{\text{Stop Loss Distance}}This formula highlights the integration of risk management into Bollinger Band-based strategies, ensuring disciplined capital allocation and consistent performance.


