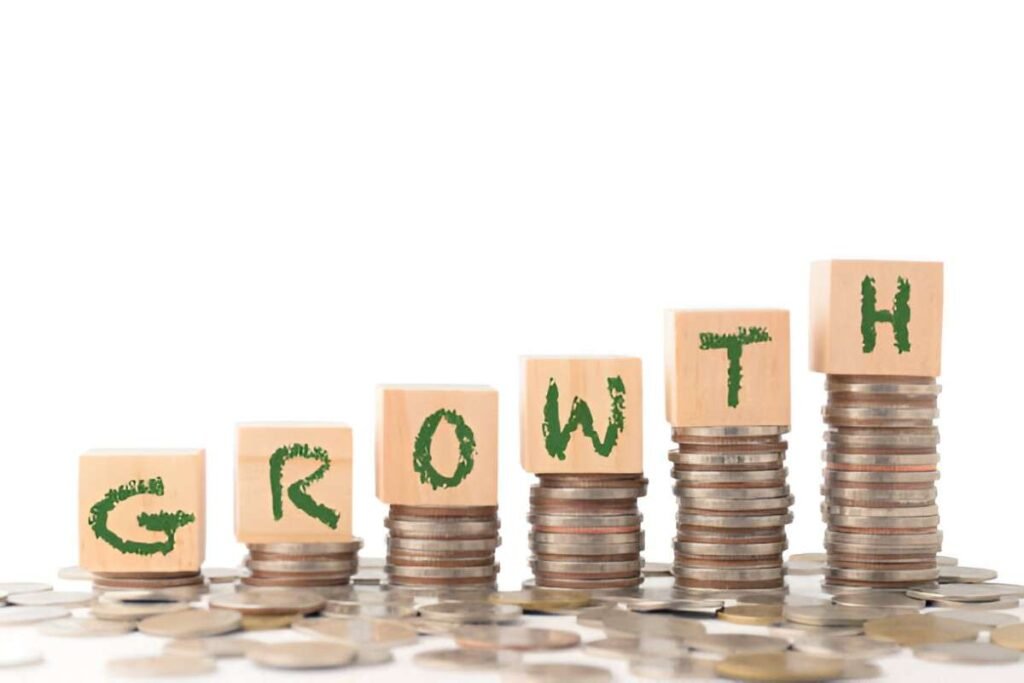
As a finance expert, I often analyze how companies generate cash from their investments. One metric I rely on is Cash Return on Invested Capital (CROIC), which measures how efficiently a firm turns capital into cold, hard cash. A 30% CROIC growth is exceptional—only elite businesses achieve it consistently. In this article, I break down what CROIC means, why a 30% growth rate is rare, and how investors can identify companies that sustain such high performance.
Table of Contents
What Is Cash Return on Invested Capital (CROIC)?
CROIC measures how much free cash flow (FCF) a company generates relative to its invested capital. Unlike traditional return metrics, CROIC focuses purely on cash—not accounting profits. The formula is:
CROIC = \frac{Free\ Cash\ Flow}{Invested\ Capital}Where:
- Free Cash Flow (FCF) = Operating Cash Flow – Capital Expenditures
- Invested Capital = Equity + Debt – Cash & Equivalents
A high CROIC means a company efficiently converts investments into cash, which it can reinvest or return to shareholders.
Why 30% CROIC Growth Is Exceptional
Most companies struggle to maintain a 10-15% CROIC. A 30% CROIC growth implies:
- Superior Capital Efficiency – The business generates $0.30 in cash for every $1 invested.
- Sustainable Competitive Advantage – Think Apple (AAPL) or Microsoft (MSFT), which dominate their industries.
- Low Reinvestment Needs – The company doesn’t need heavy capital expenditures to grow.
Comparison of CROIC Across Industries
| Industry | Average CROIC (%) | Top Performers (%) |
|---|---|---|
| Technology | 18-25 | 30-40 (e.g., AAPL) |
| Pharmaceuticals | 15-20 | 25-30 (e.g., PFE) |
| Retail | 8-12 | 15-20 (e.g., COST) |
| Manufacturing | 10-15 | 20-25 (e.g., CAT) |
As the table shows, only certain sectors consistently achieve high CROIC.
How to Calculate CROIC Growth
Let’s take Apple (AAPL) as an example:
- Free Cash Flow (2023) = $90.3 billion
- Invested Capital = $220 billion
- CROIC = \frac{90.3}{220} = 41\%
If Apple’s CROIC was 30% five years ago, its CROIC growth rate would be:
CROIC\ Growth\ Rate = \frac{41\% - 30\%}{30\%} \times 100 = 36.67\%This means Apple improved its cash generation efficiency by 36.67% over five years—an outstanding feat.
Key Drivers of 30% CROIC Growth
1. High Profit Margins
Companies with gross margins above 50% (e.g., software firms) tend to have higher CROIC because they don’t rely on heavy physical assets.
2. Low Capital Intensity
Businesses like Google (GOOGL) require minimal reinvestment to scale, unlike automakers or airlines.
3. Strong Pricing Power
Brands like Nike (NKE) can raise prices without losing customers, boosting cash flow.
4. Efficient Working Capital Management
Firms that collect receivables quickly and delay payables (e.g., Amazon (AMZN)) improve CROIC.
Risks of Over-Optimizing for CROIC
While a high CROIC is great, some risks exist:
- Underinvestment – Cutting R&D or capex to inflate CROIC can hurt long-term growth.
- Economic Cycles – Recessions can temporarily depress cash flows.
- Accounting Manipulation – Some firms tweak FCF calculations to appear stronger.
How Investors Can Use CROIC
I look for:
- Consistency – A firm should maintain high CROIC for 5+ years.
- Reinvestment Potential – Does management deploy cash wisely?
- Industry Benchmarking – A 30% CROIC in retail is rare but common in tech.
Example: Microsoft (MSFT) vs. General Motors (GM)
| Metric | Microsoft (MSFT) | General Motors (GM) |
|---|---|---|
| CROIC (2023) | 35% | 8% |
| FCF ($B) | 50.1 | 6.2 |
| Invested Capital ($B) | 143 | 77.5 |
Microsoft’s 35% CROIC reflects its asset-light model, while GM’s 8% shows capital-heavy challenges.
Final Thoughts
A 30% CROIC growth signals a world-class business. Investors should prioritize firms with durable competitive advantages, scalable models, and disciplined capital allocation. While rare, these companies—like Apple, Microsoft, and Costco—reward shareholders with strong cash returns over time.


