- Defining the Double Hump (Double Top)
- The Psychology of the Failed Retest
- Visual Anatomy of the "M" Pattern
- RSI and Volume Divergence Signatures
- The Neckline: Triggering the Downside
- Precision Short Entry Protocols
- Risk Management: Protecting Against Whipsaws
- Profit Targets and Measured Moves
- Strategic Synthesis
Defining the Double Hump (Double Top)
In the context of high-velocity momentum trading, the "Double Hump Down"—technically known as the Double Top Reversal—represents a terminal state of a trend. It occurs when a stock, having enjoyed a vertical ascent, attempts to reclaim its recent peak but fails, eventually breaking below its interim support level. This pattern signals that the aggressive buyers who fueled the initial momentum have been replaced by active sellers and profit-takers.
While a "Bull Flag" signifies a temporary pause in momentum, the double hump indicates a structural shift. The inability to print a "Higher High" is the first objective sign of weakness. For a momentum trader, this pattern is the primary signal to exit long positions and potentially transition into a short-side execution to capture the "Down" phase of the cycle.
The Psychology of the Failed Retest
To trade this pattern effectively, one must look beneath the chart at the emotional state of the participants. The "Double Hump" is a narrative of decreasing conviction.
The First Hump (Euphoria)
The initial peak is driven by high-intensity buying, often on a fresh catalyst. Everyone is bullish. Institutional and retail participants are "chasing" the verticality.
The Second Hump (Skepticism)
The retest of the high. Buyers attempt to push the price back up, but they find a wall of "hidden" institutional supply. The volume is usually lower, indicating the "fuel" is running out.
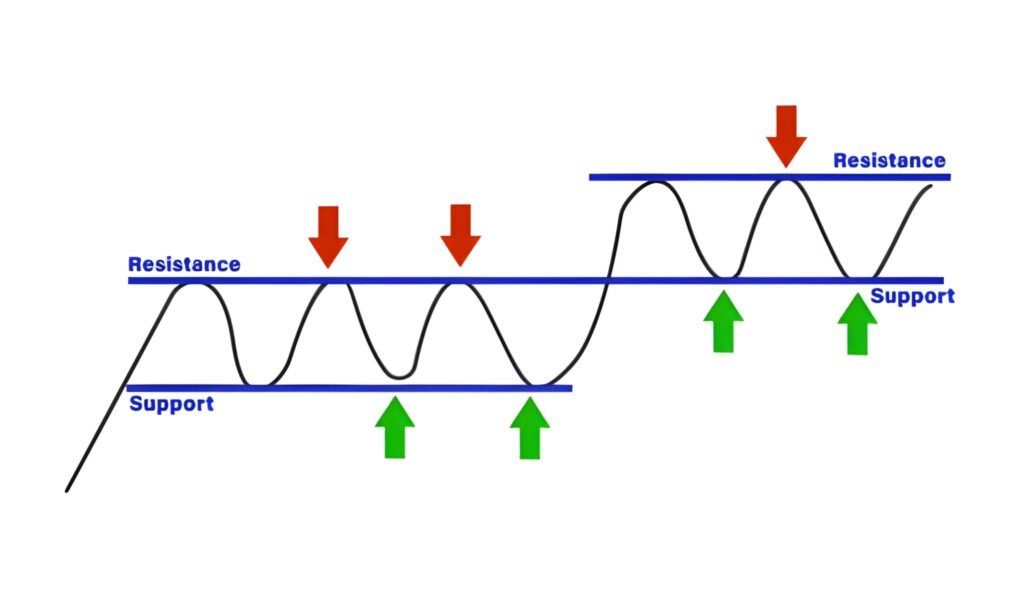
Visual Anatomy of the "M" Pattern
The pattern resembles the letter "M." Success relies on the symmetry and technical boundaries of the structure.
- The First Peak: A definitive high point followed by a pullback of 5% to 15% (the "Valley").
- The Neckline: The horizontal support level formed by the low point of the valley.
- The Second Peak: A retest that stops at or slightly below the first peak. If it goes significantly above and fails, it is called a "Bull Trap."
- The Breakdown: A high-volume candle that closes below the Neckline.
RSI and Volume Divergence Signatures
A visual double top is a suggestion; a Divergent double top is a mandate. Quantitative indicators help confirm that the second hump is weaker than the first.
| Metric | Hump 1 Signature | Hump 2 Signature | Market Implication |
|---|---|---|---|
| Volume | Massive Expansion | Noticeable Contraction | Conviction is evaporating. |
| RSI | Pegged at 80+ | Lower High (e.g., 65) | Internal velocity has peaked. |
| Tape Speed | Unreadable "Blur" | Sporadic and Heavy | Sellers are absorbing all bids. |
Bearish Divergence: If the price reaches the same level on the second hump, but the RSI (Relative Strength Index) makes a lower peak, you are witnessing "internal exhaustion." This is the highest-probability signal that the momentum is preparing to reverse.
The Neckline: Triggering the Downside
The trade does not technically exist until the Neckline is breached. Many amateur traders attempt to "short the top" of the second hump. This is a high-risk gamble, as the stock could transition into a "Triple Top" or a "Flat-Top Breakout."
The professional entry occurs when the interim support (the valley floor) is whacked. This level represents the "Floor of Consensus." Once it breaks, the bullish thesis is invalidated for all participants simultaneously, leading to the rapid "Down" phase.
Precision Short Entry Protocols
Execution must be clinical. We favor two types of entries based on the trader's risk tolerance.
Enter a short position the second a 1-minute or 5-minute candle closes below the Neckline. Use a Marketable Limit Order to ensure a fill as the liquidity vanishes. The volume should be expanding on this red candle to confirm institutional exit.
Wait for the price to break the neckline and then "bounce" back to test the old support (which should now act as resistance). Enter the short when price touches the old neckline and fails to move back above it. This provides a better risk-to-reward ratio but risks missing the trade if the stock flushes vertically without a retest.
Risk Management: Protecting Against Whipsaws
The greatest threat to a double-hump trader is the Fake-Out, where price breaks the neckline and immediately reverses.
Measured Position Sizing
Because reversals can be more violent than trends, reduce your position size compared to a standard bull-flag trade. Reversals fight the primary daily trend, meaning the "friction" of the market is higher.
Profit Targets and Measured Moves
Technical analysis provides a specific formula for the "Target" of a double-hump breakdown.
The Measured Move Formula:
Calculate the distance from the Peaks to the Neckline (e.g., $5.00). Subtract that distance from the Neckline price. This is your Primary Target.
Example: If the peaks are at $100 and the neckline is at $90, the pattern height is $10. The downside target is $80 ($90 - $10). Most professionals sell 50% of the position at this measured target and trail the remainder using the 9-period EMA.
The Double Hump Down is a masterclass in market physics. It is the visual realization of a trend losing its kinetic energy. By focusing on the divergence between price and RSI, waiting for the high-volume breakdown of the neckline, and utilizing measured move targets, you can navigate these reversals with the same surgical precision as a momentum breakout.
Remember: momentum is a guest that eventually leaves. The "Double Hump" is the guest putting on their coat. Don't be the one left holding the bill as the lights go out. Trade the exhaustion, respect the neckline, and follow the math of the reversal.


