Candlestick patterns are essential tools for day traders because they provide a visual representation of market sentiment, supply and demand, and potential price reversals. Recognizing these patterns can help traders make faster, more informed decisions during intraday trading. This article explores the most important candlestick patterns for day trading, how to interpret them, and practical examples of their use in U.S. markets.
Understanding Candlestick Basics
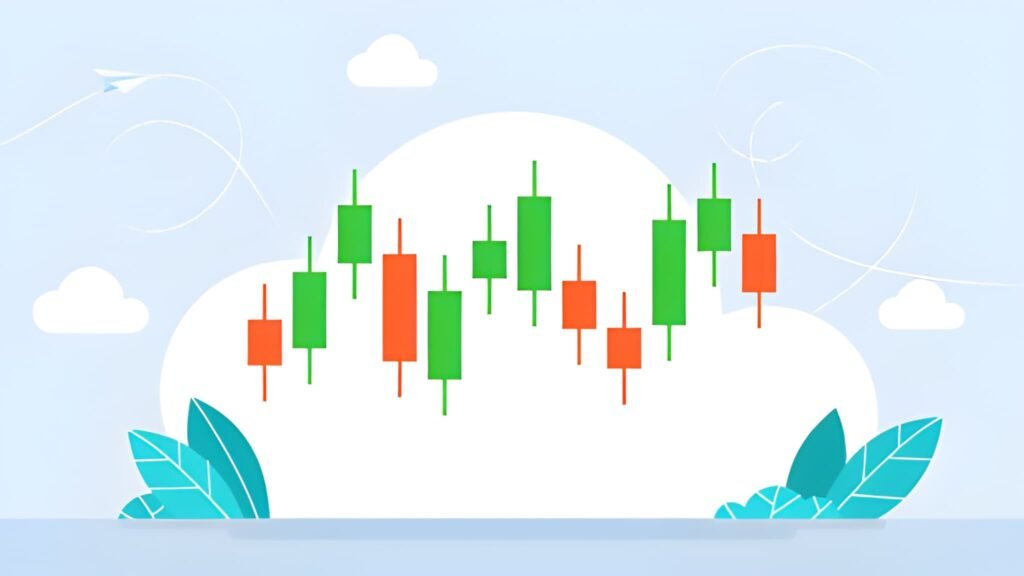
A candlestick represents price action over a specific time frame—minutes, hours, or days. Each candlestick has four main components:
- Open (O): The price at the start of the time frame
- High (H): The highest price during the period
- Low (L): The lowest price during the period
- Close (C): The price at the end of the time frame
The body of the candle is the distance between the open and close.
- Bullish candle: Close > Open, typically green or white
- Bearish candle: Close < Open, typically red or black
Shadows/wicks represent the high and low prices outside the body.
Importance of Candlestick Patterns in Day Trading
Candlestick patterns help traders:
- Identify potential reversals or trend continuations
- Gauge intraday momentum
- Set entry, stop-loss, and exit points
- Confirm signals from technical indicators like moving averages, RSI, or MACD
Popular Day Trading Candlestick Patterns
1. Doji
- Description: Open and close are nearly equal, forming a cross or plus sign.
- Interpretation: Indicates market indecision; a potential reversal if it occurs after a strong trend.
- Example:
- Stock XYZ is trending up, forms a Doji at resistance.
- Traders may wait for confirmation: a bearish candle afterward could indicate a reversal.
2. Hammer and Hanging Man
- Hammer: Small body at the top, long lower wick, appears after a downtrend. Suggests potential bullish reversal.
- Hanging Man: Same shape as hammer but appears after an uptrend. Suggests potential bearish reversal.
- Example:
- Stock ABC drops to $50 intraday, forms a hammer with a lower wick to $48, closes at $50.50.
- Entry: $51 on confirmation candle.
- Stop-loss: $48.
3. Engulfing Patterns
- Bullish Engulfing: A small bearish candle followed by a larger bullish candle that completely engulfs the previous body. Indicates strong reversal potential.
- Bearish Engulfing: A small bullish candle followed by a larger bearish candle.
- Example:
- Stock DEF shows a downtrend.
- Day candle: small red at $100, next candle: green closing at $105, engulfing previous red candle.
- Entry: $105, stop-loss $99.
4. Morning Star and Evening Star
- Morning Star: Bullish reversal pattern; consists of a long bearish candle, a small indecision candle (Doji or spinning top), followed by a long bullish candle.
- Evening Star: Bearish reversal pattern; opposite formation.
- Example:
- Morning Star at $200 support level signals potential upward move.
- Entry: Above bullish confirmation candle, stop-loss below star’s low.
5. Shooting Star
- Small body at the bottom, long upper wick, occurs after an uptrend. Indicates potential bearish reversal.
- Example:
- Stock GHI rallies from $150 to $160, forms a shooting star at $160.
- Entry: Short below confirmation candle at $158.
- Stop-loss: Above high at $162.
6. Spinning Top
- Small body with wicks on both ends. Indicates indecision in the market. Often seen before a reversal or trend continuation.
- Example:
- Stock JKL shows spinning tops after a strong uptrend; traders may wait for confirmation before entering.
7. Three White Soldiers and Three Black Crows
- Three White Soldiers: Three consecutive long bullish candles after a downtrend. Indicates strong upward momentum.
- Three Black Crows: Three consecutive bearish candles after an uptrend. Indicates strong downward momentum.
- Example:
- Momentum trader sees three white soldiers on 5-minute candles for TSLA, enters long at $720.
Combining Candlestick Patterns with Indicators
Candlestick patterns are more powerful when combined with technical indicators:
- Moving Averages: Confirm trend direction
- RSI: Validate overbought or oversold conditions
- Volume: Confirm the strength of reversal or breakout
Example:
- A bullish engulfing candle on high volume with RSI below 30 increases probability of a profitable trade.
Practical Day Trading Tips with Candlestick Patterns
- Time Frame Matters: Use 1-minute, 5-minute, or 15-minute charts for intraday trading. Longer time frames may dilute signals.
- Wait for Confirmation: Avoid entering trades solely based on the pattern; wait for the next candle or a volume spike.
- Set Stop-Loss Orders: Place stops below/above wicks to protect against false signals.
- Combine with Support and Resistance: Candlestick patterns near key levels increase reliability.
- Avoid Overtrading: Only act on high-probability setups that align with your strategy.
Example: Using Candlestick Patterns in a Day Trade
- Stock: NVDA, 5-minute chart
- Scenario: Stock trending up, forms a hammer at $320 with lower wick to $318
- Indicators: RSI = 28 (oversold), volume 2x average
- Trade: Enter long at $321 after confirmation candle
- Stop-loss: $318
- Target: $328
Conclusion
Candlestick patterns provide day traders with valuable insight into market psychology and potential price reversals. Patterns such as Doji, Hammer, Engulfing, Morning/Evening Star, Shooting Star, and Three Soldiers/Crows are especially useful for intraday setups. By combining these patterns with technical indicators, support and resistance levels, and volume analysis, traders can improve the accuracy of entries and exits. Discipline, confirmation, and risk management remain key to consistently using candlestick patterns effectively in day trading.


