Introduction
When analyzing cryptocurrencies, one of the most overlooked yet crucial aspects of valuation is token supply and inflation. While investors often focus on market capitalization, utility, and hype, understanding how a cryptocurrency’s supply mechanics influence its value can provide deep insights into its long-term price potential.
In this article, I will explore how token supply and inflation impact crypto valuation, supported by real-world examples, calculations, and historical data. By the end, you’ll have a clear understanding of how these factors shape market behavior and how you can use this knowledge to make better investment decisions.
Understanding Token Supply
Token supply in cryptocurrencies falls into three primary categories:
- Total Supply: The number of tokens that will ever exist, including those not yet in circulation.
- Circulating Supply: The number of tokens currently available in the market.
- Max Supply: The hard cap on token creation, if one exists.
Token Supply and Market Capitalization
Market capitalization is calculated as:
\text{Market Cap} = \text{Circulating Supply} \times \text{Current Price} \text{Circulating Supply} \times \text{Current Price}For example, if a cryptocurrency has a circulating supply of 50 million tokens and a price of $10 per token, its market cap is:
50,000,000 \times 10 = 500,000,000However, this figure alone doesn’t tell us whether the asset is overvalued or undervalued—it must be analyzed alongside supply dynamics and inflation.
The Role of Inflation in Crypto Valuation
Inflation in crypto refers to the increase in token supply over time. Some cryptocurrencies, like Bitcoin, have a deflationary model with a fixed supply, while others, like Ethereum, have a flexible inflationary mechanism.
Inflation Rate Calculation
The annual inflation rate of a cryptocurrency is calculated as:
\text{Inflation Rate} = \left( \frac{\text{New Tokens Issued Annually}}{\text{Total Supply}} \right) \times 100For example, if a cryptocurrency issues 1 million new tokens per year and has a total supply of 20 million tokens, its inflation rate is:
\left( \frac{1,000,000}{20,000,000} \right) \times 100 = 5%Impact of Inflation on Token Price
If demand remains constant while supply increases, the price per token may decrease. This is similar to fiat currency inflation, where an increase in money supply reduces purchasing power.
Let’s compare two hypothetical cryptocurrencies:
| Cryptocurrency | Initial Supply | New Tokens per Year | Inflation Rate |
|---|---|---|---|
| Crypto A | 10,000,000 | 500,000 | 5% |
| Crypto B | 10,000,000 | 1,000,000 | 10% |
If demand stays the same, Crypto B’s price is more likely to decline faster than Crypto A’s due to higher inflation.
Deflationary vs. Inflationary Models
Some cryptocurrencies implement deflationary measures, while others embrace inflation for ecosystem sustainability. Here’s a comparison:
| Model | Example Cryptos | Characteristics | Potential Impact |
|---|---|---|---|
| Deflationary | Bitcoin (BTC) | Fixed max supply, halving events | Scarcity may drive long-term price appreciation |
| Inflationary | Ethereum (ETH), Dogecoin (DOGE) | No fixed max supply, flexible issuance | May support network growth but risks price dilution |
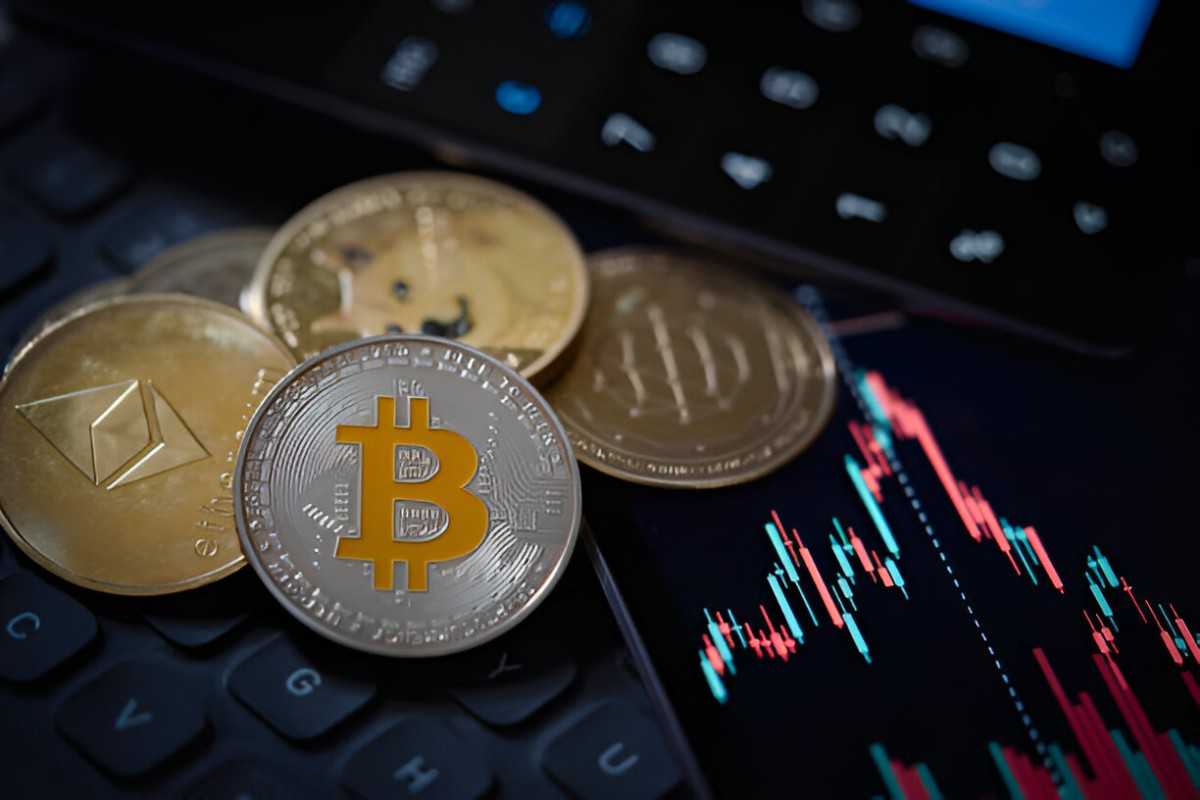
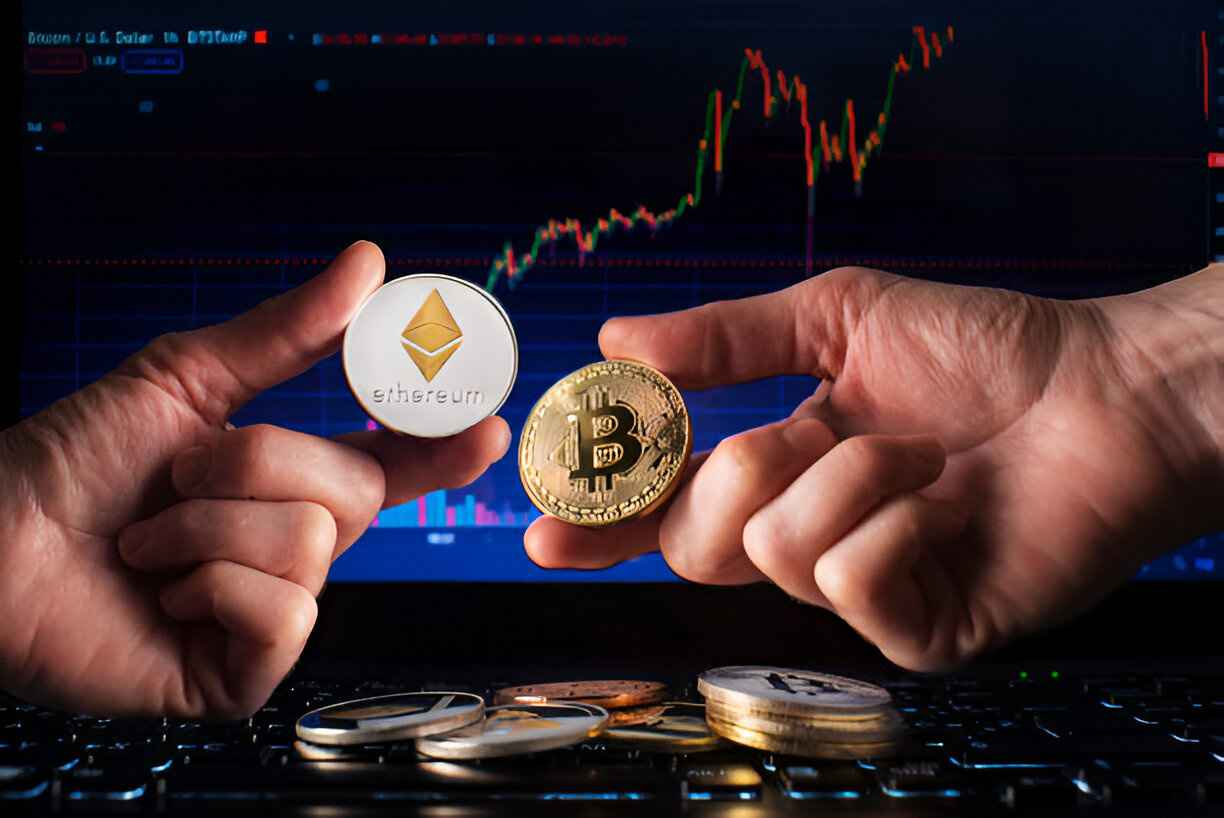
Case Study: Bitcoin vs. Ethereum
Bitcoin’s Fixed Supply Model
Bitcoin has a max supply of 21 million coins. Every four years, Bitcoin undergoes a “halving,” reducing the block reward for miners. This programmed scarcity has contributed to Bitcoin’s price appreciation over time.
For instance, after the 2012, 2016, and 2020 halvings, Bitcoin’s price surged within the following years due to supply shocks.
| Halving Year | Block Reward Before | Block Reward After | BTC Price After 1 Year |
|---|---|---|---|
| 2012 | 50 BTC | 25 BTC | ~$1,000 |
| 2016 | 25 BTC | 12.5 BTC | ~$2,500 |
| 2020 | 12.5 BTC | 6.25 BTC | ~$60,000 |
Ethereum’s Evolving Inflation Model
Ethereum initially had an uncapped supply with a high issuance rate, leading to concerns about inflation. However, Ethereum’s transition to Proof-of-Stake and the EIP-1559 upgrade introduced a burning mechanism that reduces supply over time.
Since the EIP-1559 upgrade, Ethereum’s net issuance has decreased, sometimes making ETH deflationary when network activity is high.
Real-World Examples and Implications
The Effect of High Inflation: Dogecoin
Dogecoin has no supply cap and issues approximately 5 billion DOGE annually. This has historically suppressed price growth because the supply expansion outpaces demand.
The Effect of Scarcity: Binance Coin (BNB)
Binance Coin implements quarterly token burns, reducing supply over time. This strategy has helped maintain price stability and drive appreciation.
Strategies for Investors
Investors should consider:
- Supply Mechanics: Check whether the cryptocurrency has a fixed, inflationary, or deflationary supply model.
- Inflation Rate: Compare the inflation rate with demand projections.
- Burning Mechanisms: Look for token-burning strategies that offset inflation.
- Long-Term Viability: Assess whether inflationary models support ecosystem growth or dilute value.
Conclusion
Understanding token supply and inflation is critical to crypto valuation. Scarcity can drive long-term price appreciation, while uncontrolled inflation can lead to depreciation. Investors should analyze these metrics before making investment decisions to avoid common pitfalls. By applying this knowledge, we can make more informed choices in the volatile world of cryptocurrency investing.