Candlestick patterns are a powerful tool for analyzing price movements in financial markets. When used correctly, they offer insight into market sentiment, helping traders make informed decisions. I have found that candlestick charts provide an intuitive way to read price action compared to traditional bar or line charts. In this article, I will break down the importance of candlestick patterns in trading, explain key formations, discuss their historical relevance, and show how to apply them in real-world trading.
Understanding Candlestick Charts
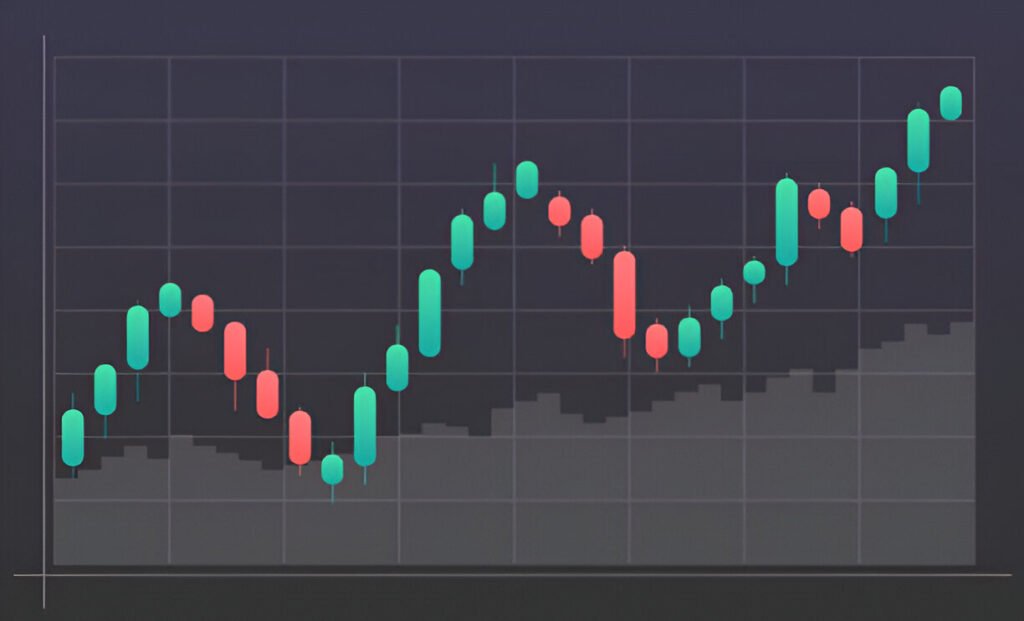
A candlestick chart consists of individual candles representing a specific time frame, such as a minute, hour, or day. Each candle has four key components:
- Open Price: The price at which the asset started trading during the selected period.
- Close Price: The price at which the asset finished trading in that period.
- High Price: The highest price reached during the period.
- Low Price: The lowest price reached during the period.
Anatomy of a Candlestick
| Component | Description |
|---|---|
| Body | The rectangular area between the open and close price. If the close price is higher than the open, the body is usually green (bullish); otherwise, it is red (bearish). |
| Wick (Shadow) | The thin lines above and below the body indicating the high and low prices. |
| Doji | A candle where the open and close prices are nearly the same, indicating indecision. |
Why Candlestick Patterns Matter
Candlestick patterns provide visual cues about market psychology. They help traders understand potential reversals, continuation signals, and trend strength. By identifying patterns in real-time, I have often been able to anticipate price movements before they happen.
Key Candlestick Patterns and Their Meaning
Bullish Reversal Patterns
| Pattern | Description | Market Implication |
|---|---|---|
| Hammer | Small body, long lower wick, appearing at the bottom of a downtrend. | Indicates potential reversal to an uptrend. |
| Bullish Engulfing | Large bullish candle completely engulfs the previous bearish candle. | Strong buying pressure, potential upward movement. |
| Morning Star | Three-candle pattern with a long bearish candle, a small-bodied candle, and a strong bullish candle. | Indicates reversal to an uptrend. |
Bearish Reversal Patterns
| Pattern | Description | Market Implication |
|---|---|---|
| Shooting Star | Small body, long upper wick, appearing at the top of an uptrend. | Potential reversal to a downtrend. |
| Bearish Engulfing | Large bearish candle engulfs the previous bullish candle. | Strong selling pressure, potential downward movement. |
| Evening Star | Opposite of the Morning Star, signals potential bearish reversal. | Indicates a shift to a downtrend. |
Historical Performance of Candlestick Patterns
Research has shown that certain candlestick patterns have a statistically significant predictive ability. A study conducted on the S&P 500 index found that bullish engulfing patterns led to an average price increase of 2.4% within five days, while bearish engulfing patterns resulted in an average 2.1% decline over the same period.
Example Calculation: Bullish Engulfing Pattern
Let’s say a stock has the following prices:
- Previous candle: Open = $50, Close = $48
- Current candle: Open = $47, Close = $52
Since the second candle completely engulfs the previous one and closes higher, it signals a bullish reversal. If a trader entered at $52 and the stock moved up 2.4% in five days, the new price would be:
52 \times (1 + 0.024) = 53.25Practical Application in Trading
While candlestick patterns provide valuable insights, they should be used in conjunction with other indicators for confirmation. Some traders use:
- Moving Averages: To identify trends.
- RSI (Relative Strength Index): To gauge momentum.
- Volume Analysis: To confirm breakouts.
Example: Combining Candlestick Patterns with RSI
If a bullish engulfing pattern appears and the RSI is below 30 (indicating oversold conditions), it strengthens the likelihood of an upward move.
Limitations of Candlestick Patterns
Candlestick patterns are not foolproof. They can sometimes produce false signals, especially in low-volume markets. To mitigate this risk, I use them alongside fundamental analysis and broader market trends.
Conclusion
Candlestick patterns are a critical component of technical analysis. They provide traders with a structured way to interpret price action and make informed decisions. However, they should be used with other indicators and risk management strategies to maximize effectiveness. By mastering these patterns, traders can improve their market timing and enhance their profitability.


