Introduction
Fibonacci retracement is one of the most reliable tools traders use to identify potential support and resistance levels. I use it to analyze market trends, predict pullbacks, and refine my entry and exit strategies. The concept is rooted in mathematics and appears in financial markets across various timeframes. In this guide, I will break down Fibonacci retracement, explain how to apply it in trading, and provide real-world examples with calculations.
What Is Fibonacci Retracement?
Fibonacci retracement is a technical analysis tool based on the Fibonacci sequence, a series of numbers where each number is the sum of the two preceding ones. The sequence begins as follows:
0, 1, 1, 2, 3, 5, 8, 13, 21, 34, 55, 89, 144, ...In trading, Fibonacci retracement levels are derived from the key ratios:
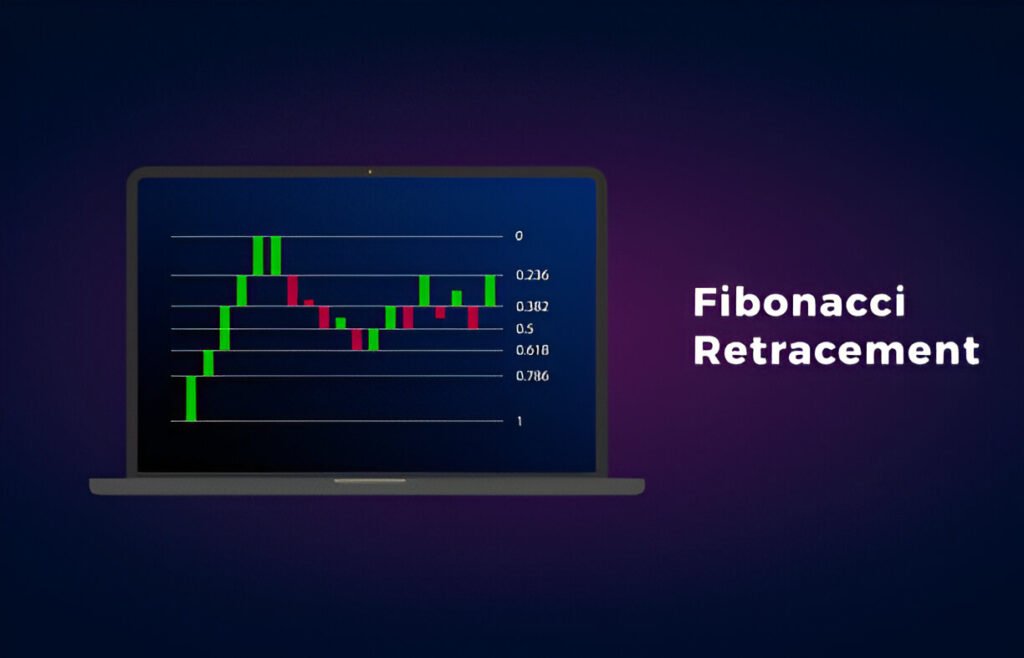
- 23.6%
- 38.2%
- 50% (not a Fibonacci number but commonly used)
- 61.8%
- 78.6%
These levels indicate potential areas where an asset’s price may find support or resistance before continuing its trend.
How Fibonacci Retracement Works
1. Identifying a Trend
Before applying Fibonacci retracement, I first determine whether the market is in an uptrend or downtrend. If the market is trending up, I draw Fibonacci levels from the lowest swing low to the highest swing high. If it’s trending down, I draw from the highest swing high to the lowest swing low.
2. Drawing Fibonacci Levels
Most charting platforms have built-in Fibonacci retracement tools. I apply the tool by selecting the significant swing points, and the platform automatically plots the retracement levels.
3. Interpreting the Levels
Each retracement level represents a potential reversal or continuation zone. Here’s how I use them:
- 23.6% Level: A minor pullback, indicating strong momentum.
- 38.2% Level: A moderate retracement level where price often finds support.
- 50% Level: A common psychological level where a trend may resume.
- 61.8% Level: A critical support/resistance level based on the Golden Ratio.
- 78.6% Level: A deep retracement level where reversals frequently happen.
Example: Applying Fibonacci Retracement
Let’s say a stock moves from $100 to $150. To apply Fibonacci retracement:
- The difference between high and low is:
Calculate retracement levels:
- 23.6%: 150 - (50 \times 0.236) = 138.2
- 38.2%: 150 - (50 \times 0.382) = 130.9
- 50.0%: 150 - (50 \times 0.5) = 125.0
- 61.8%: 150 - (50 \times 0.618) = 119.1
- 78.6%: 150 - (50 \times 0.786) = 110.7
The retracement levels are potential buying zones if the stock pulls back.
Fibonacci Retracement vs. Other Indicators
| Feature | Fibonacci Retracement | Moving Averages | RSI |
|---|---|---|---|
| Purpose | Identifies support/resistance | Smooths price action | Measures overbought/oversold |
| Best Used For | Pullbacks in trends | Trend confirmation | Momentum assessment |
| Drawback | Subjective placement | Lags price action | Not ideal for trend reversals |
Historical Application
Fibonacci retracement has been used in major market corrections. During the 2008 financial crisis, the S&P 500 retraced nearly 61.8% before resuming an uptrend. Similarly, in 2020, the COVID-19 crash found support around the 50% retracement level before rebounding.
Conclusion
I rely on Fibonacci retracement to anticipate price movements and improve my trade timing. It is not foolproof, but when combined with volume analysis, candlestick patterns, and other indicators, it becomes a powerful tool. Whether I’m trading stocks, forex, or crypto, Fibonacci retracement helps me make informed decisions with confidence.


