Introduction
When I analyze an earnings report, the first numbers I look at are a company’s profit margins. These tell me how efficiently the company turns revenue into profit at different stages. Gross margin, operating margin, and net margin each reveal different insights about a business’s profitability and cost structure. Understanding these margins is essential for making informed investment decisions.
In this article, I’ll break down how to analyze these three key profit margins, what they reveal about a company’s financial health, and how they compare across industries. I’ll also provide real-world examples, calculations, and tables to illustrate these concepts.
Understanding Gross Margin
What is Gross Margin?
\text{Gross Margin} = \frac{\text{Revenue} - \text{Cost of Goods Sold (COGS)}}{\text{Revenue}} \times 100Why is Gross Margin Important?
Gross margin shows how efficiently a company produces its products. A high gross margin means the company has strong pricing power or lower production costs. A declining gross margin could indicate rising raw material costs, increased competition, or an inability to pass costs to customers.
Example Calculation
Let’s say a company has the following financials:
| Item | Amount ($) |
|---|---|
| Revenue | 1,000,000 |
| Cost of Goods Sold (COGS) | 600,000 |
A 40% gross margin means the company retains 40 cents for every dollar of revenue after covering production costs.
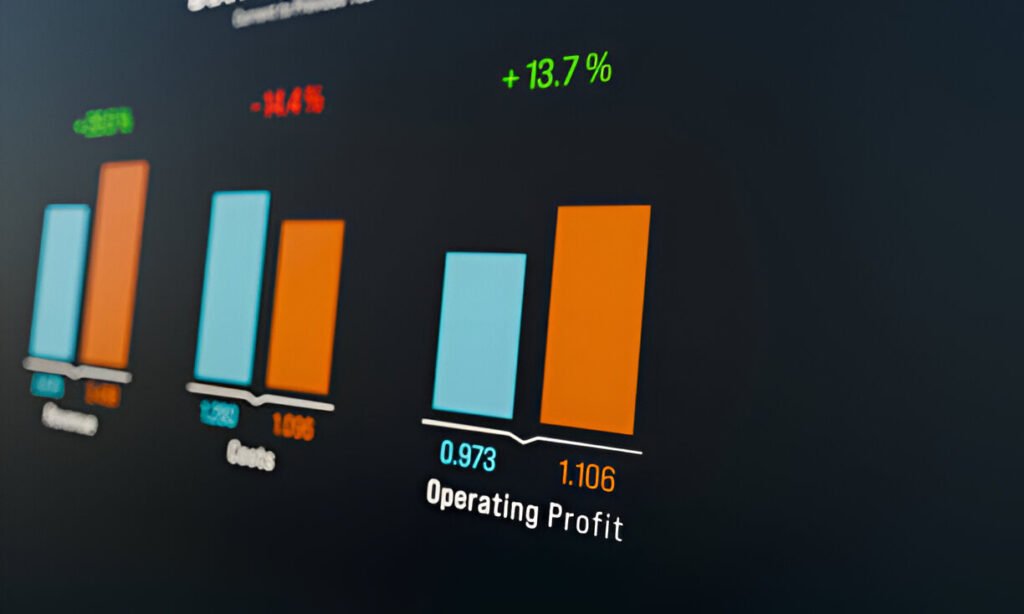
Understanding Operating Margin
What is Operating Margin?
\text{Operating Margin} = \frac{\text{Operating Income}}{\text{Revenue}} \times 100 \text{Operating Income} = \text{Revenue} - \text{COGS} - \text{Operating Expenses}Why is Operating Margin Important?
Operating margin measures how efficiently a company manages its operating costs. It reflects a company’s ability to control costs beyond production, including administrative and sales expenses.
Example Calculation
Using the previous example, assume the company also has $200,000 in operating expenses:
| Item | Amount ($) |
|---|---|
| Revenue | 1,000,000 |
| Cost of Goods Sold (COGS) | 600,000 |
| Operating Expenses | 200,000 |
A 20% operating margin indicates that after covering production and operational costs, the company keeps 20 cents per dollar in revenue.
Understanding Net Margin
What is Net Margin?
\text{Net Margin} = \frac{\text{Net Income}}{\text{Revenue}} \times 100Why is Net Margin Important?
Net margin measures the ultimate profitability of a company. Investors rely on net margin to determine how much actual profit is available to shareholders after all expenses.
Example Calculation
Let’s assume the company also has $50,000 in interest and $50,000 in taxes:
| Item | Amount ($) |
|---|---|
| Revenue | 1,000,000 |
| Cost of Goods Sold (COGS) | 600,000 |
| Operating Expenses | 200,000 |
| Interest Expense | 50,000 |
| Taxes | 50,000 |
A 15% net margin shows that the company keeps 15 cents per dollar of revenue after all expenses.
Comparing Margins Across Industries
Different industries have varying margin structures. Here’s a comparison of average margins across sectors:
| Industry | Gross Margin | Operating Margin | Net Margin |
|---|---|---|---|
| Software | 75% | 30% | 25% |
| Retail | 30% | 10% | 5% |
| Automotive | 20% | 7% | 3% |
| Food & Beverage | 40% | 15% | 8% |
Key Takeaways for Investors
- Trend Analysis: Look at margin trends over several quarters to identify improvements or declines.
- Industry Benchmarks: Compare margins to industry averages to assess competitiveness.
- Cost Control: Companies with stable or improving operating margins likely manage costs well.
- Sustainability: High gross margins but declining net margins could signal rising expenses.
- Economic Impact: Inflation and interest rates can affect margins differently across industries.
Conclusion
Analyzing profit margins in earnings reports helps me understand a company’s efficiency, cost structure, and profitability. Gross margin shows production efficiency, operating margin reflects cost control, and net margin reveals the final profitability. Comparing these metrics across industries and tracking trends over time helps make better investment decisions. By mastering margin analysis, I can identify strong businesses that manage costs effectively and deliver consistent profits.


